- 本文链接:ECharts 巧用富文本标签 rich 实现 label 中文字自定义 color、backgroundColor 等属性
- 版权声明: 本博客所有文章除特别声明外,均采用
BY-NC-SA 许可协议,转载请注明出处!
ECharts 巧用富文本标签 rich 实现 label 中文字自定义 color、backgroundColor 等属性
2019/6/20大约 2 分钟
ECharts 巧用富文本标签 rich 实现 label 中文字自定义 color、backgroundColor 等属性
ECharts 中label都支持formatter和rich,label可能会有多个属性组合而成, 如下图所示,访问来源就是一个通过formatter和rich自定义的一个label。
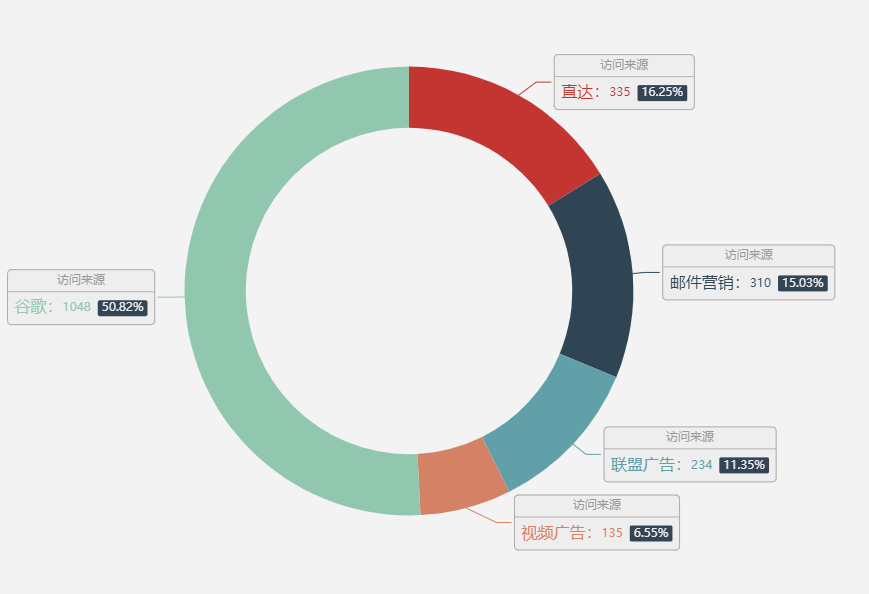
部分代码如下所示:
series: [
  {
    name: '访问来源',
    type: 'pie',
    radius: ['40%', '55%'],
    label: {
      normal: {
        formatter: '{a|{a}}\n{hr|}\n  {b|{b}:}{c}  {per|{d}%}  ',
        backgroundColor: '#eee',
        borderColor: '#aaa',
        borderWidth: 1,
        borderRadius: 4,
        rich: {
          a: {
            color: '#999',
            lineHeight: 22,
            align: 'center'
          },
          hr: {
            borderColor: '#aaa',
            width: '100%',
            borderWidth: 0.5,
            height: 0
          },
          b: {
            fontSize: 16,
            lineHeight: 33
          }
        }
      }
    }
  }
]其中访问来源和百分比如果我想要保持和色块同一个颜色,即如下图所示
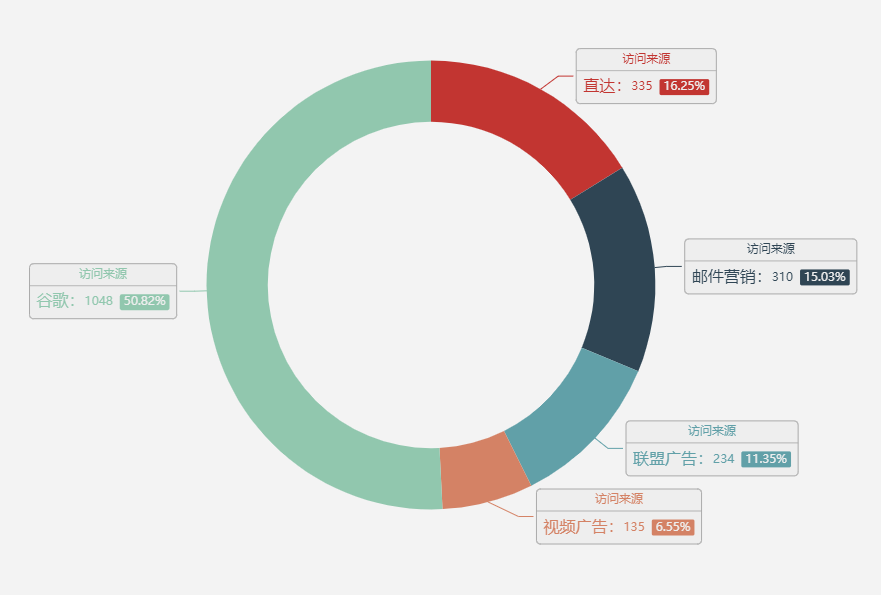
此时可以在rich定义多个属性,代表不同的颜色值和背景色 如下所示的color0-color4和bg0-bg4
const per = {
  color: '#eee',
  padding: [2, 4],
  borderRadius: 2
}
rich: {
  color0: {
    color: '#c23531',
    lineHeight: 22,
    align: 'center'
  },
  color1: {
    color: '#2f4554',
    lineHeight: 22,
    align: 'center'
  },
  color2: {
    color: '#61a0a8',
    lineHeight: 22,
    align: 'center'
  },
  color3: {
    color: '#d48265',
    lineHeight: 22,
    align: 'center'
  },
  color4: {
    color: '#91c7ae',
    lineHeight: 22,
    align: 'center'
  },
  bg0: {
    ...per,
    backgroundColor: '#c23531'
  },
  bg1: {
    ...per,
    backgroundColor: '#2f4554'
  },
  bg2: {
    ...per,
    backgroundColor: '#61a0a8'
  },
  bg3: {
    ...per,
    backgroundColor: '#d48265'
  },
  bg4: {
    ...per,
    backgroundColor: '#91c7ae'
  }
}最后利用formatter配合rich就能实现自定义效果,此处用了 ES6 的字符串拼接方法,/斜杠是为了转义rich的大括号
formatter: (params) => {
  console.log(params)
  const seriesName = params.seriesName
  const name = params.name
  const value = params.data.value
  const percent = params.percent + '%'
  const index = params.dataIndex
  return `\{color${index}|${seriesName}\}\n\{hr|\}\n  \{b|${name}:\}${value}  \{bg${index}|${percent}\}  `
}
完整代码: 可直接复制代码到此处直接运行:https://www.echartsjs.com/examples/editor.html
const per = {
  color: '#eee',
  padding: [2, 4],
  borderRadius: 2
}
option = {
  tooltip: {
    trigger: 'item',
    formatter: '{a} <br/>{b}: {c} ({d}%)'
  },
  series: [
    {
      name: '访问来源',
      type: 'pie',
      radius: ['40%', '55%'],
      label: {
        normal: {
          //formatter: '{a|{a}}{abg|}\n{hr|}\n  {b|{b}:}{c}  {per|{d}%}  ',
          formatter: (params) => {
            console.log(params)
            const seriesName = params.seriesName
            const name = params.name
            const value = params.data.value
            const percent = params.percent + '%'
            const index = params.dataIndex
            return `\{color${index}|${seriesName}\}\n\{hr|\}\n  \{b|${name}:\}${value}  \{bg${index}|${percent}\}  `
          },
          backgroundColor: '#eee',
          borderColor: '#aaa',
          borderWidth: 1,
          borderRadius: 4,
          rich: {
            hr: {
              borderColor: '#aaa',
              width: '100%',
              borderWidth: 0.5,
              height: 0
            },
            b: {
              fontSize: 16,
              lineHeight: 33
            },
            color0: {
              color: '#c23531',
              lineHeight: 22,
              align: 'center'
            },
            color1: {
              color: '#2f4554',
              lineHeight: 22,
              align: 'center'
            },
            color2: {
              color: '#61a0a8',
              lineHeight: 22,
              align: 'center'
            },
            color3: {
              color: '#d48265',
              lineHeight: 22,
              align: 'center'
            },
            color4: {
              color: '#91c7ae',
              lineHeight: 22,
              align: 'center'
            },
            bg0: {
              ...per,
              backgroundColor: '#c23531'
            },
            bg1: {
              ...per,
              backgroundColor: '#2f4554'
            },
            bg2: {
              ...per,
              backgroundColor: '#61a0a8'
            },
            bg3: {
              ...per,
              backgroundColor: '#d48265'
            },
            bg4: {
              ...per,
              backgroundColor: '#91c7ae'
            }
          }
        }
      },
      data: [
        { value: 335, name: '直达' },
        { value: 310, name: '邮件营销' },
        { value: 234, name: '联盟广告' },
        { value: 135, name: '视频广告' },
        { value: 1048, name: '谷歌' }
      ]
    }
  ]
} Cloudflare
 1Panel
 VuePress
 VuePress Theme Hope